
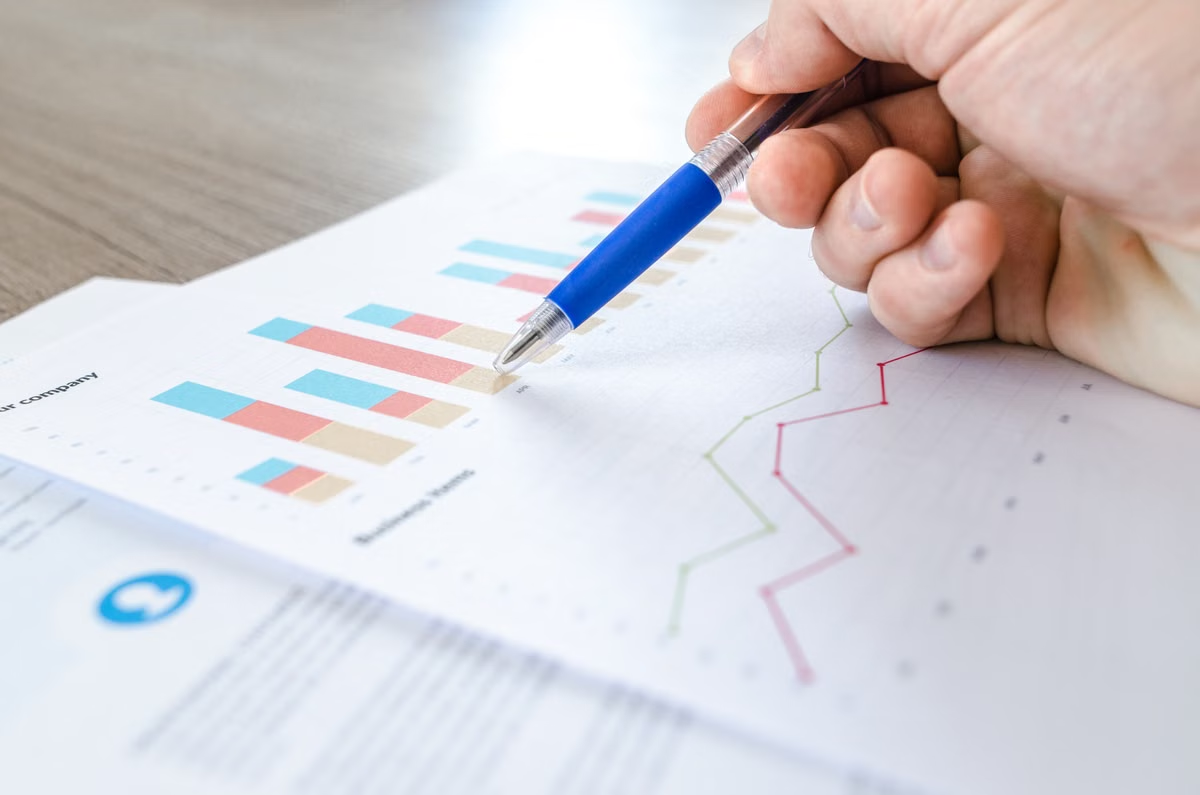
In today’s fast-paced business environment, waiting until month-end or quarter-end to review your financial position can delay important decisions. Real-time financial reporting gives businesses immediate access to accurate and up-to-date financial information. Finquest Business Solutions provides reliable Financial Reporting Services and Financial Dashboard Services to businesses across Australia, the USA, the UK and the UAE, helping management teams monitor performance, identify potential issues and make informed decisions with confidence.
What Is Real-Time Financial Reporting?
Real-time financial reporting is the continuous collection, processing and presentation of financial data as business transactions occur. Instead of relying only on outdated spreadsheets or periodic reports, decision-makers can view current financial information through a centralised and easy-to-understand dashboard.
A real-time financial dashboard can help you monitor:
- Current revenue, operating expenses and net income
- Outstanding invoices, accounts receivable and cash flow
- Payroll expenses and upcoming financial liabilities
- Profit margins by product, service, department or region
- Budget performance and financial forecasts
- Key performance indicators relevant to business growth
When integrated with your accounting systems, financial dashboards transform complex data into clear visual reports. This enables business owners and stakeholders to quickly understand financial performance, detect unusual trends and take timely action.
What Is a Financial Dashboard?
A financial dashboard is a visual reporting tool that brings your most important financial metrics together in one place. It converts complex financial data into clear charts, summaries and key performance indicators, allowing business owners and management teams to monitor financial health and make faster, data-driven decisions.
| Dashboard Element | Business Insight Provided |
|---|---|
| Revenue Tracker | Compares actual revenue with monthly, quarterly or annual targets |
| Expense Overview | Shows where money is being spent and highlights unusual costs |
| Cash Flow Analysis | Tracks cash inflows, outflows and the company’s liquidity position |
| Accounts Receivable | Identifies outstanding invoices, payment deadlines and overdue accounts |
| Profit and Loss Summary | Provides an updated view of income, expenses and overall profitability |
| Budget vs. Actual | Compares planned budgets with actual financial performance |
| KPI Indicators | Displays customised financial metrics relevant to business objectives |
6 Ways Real-Time Reporting and Dashboards Improve Decision-Making
1. 🚀 Make Faster, Data-Driven Decisions
Access to up-to-date financial data allows management teams to respond quickly. Whether approving a major purchase, adjusting prices or reallocating budgets, decisions can be based on accurate information rather than assumptions.
2. 🔍 Identify Financial Problems Early
Real-time financial reporting acts as an early-warning system. Businesses can quickly identify declining cash flow, increasing expenses, overdue invoices or underperforming revenue streams before they develop into serious financial problems.
3. 🎯 Align Teams Around Accurate Data
A centralised financial dashboard creates a single, reliable source of information for finance, operations and leadership teams. This improves communication, reduces conflicting reports and keeps everyone focused on shared business objectives.
4. 🌍 Monitor Multi-Country Operations
Businesses operating across Australia, the USA, the UK and the UAE can monitor regional revenue, costs, cash flow and profitability through one unified dashboard. This makes international financial management simpler and more transparent.
5. 💼 Build Stakeholder Confidence
Clear and professionally presented financial reports demonstrate transparency, accountability and strong financial control. They help business owners communicate performance effectively to investors, lenders and other stakeholders.
6. 📉 Reduce Manual Reporting Work
Automated dashboards reduce dependence on spreadsheets and repetitive data-entry tasks. This saves time, minimises human error and allows finance teams to focus on analysis, forecasting and strategic planning.
How Finquest Builds Your Financial Reporting and Dashboard Solution
Step 1 – Understand Your Business Requirements
We assess your business model, reporting challenges, key financial metrics and decision-making requirements to create a solution aligned with your objectives.
Step 2 – Establish a Reliable Accounting Foundation
Our team organises and reviews your bookkeeping processes to ensure that the financial data used for reporting is accurate, complete and up to date.
Step 3 – Create Your Custom Financial Dashboard
We design a customised dashboard that presents essential financial information, including revenue, expenses, profitability, cash flow and KPIs, in a clear visual format.
Step 4 – Deliver Accurate Financial Reports
Finquest provides timely profit and loss statements, balance sheets, cash-flow reports and management reports to give you complete visibility into business performance.
Step 5 – Support Better Business Decisions
Our experts help you interpret financial trends, identify potential risks and uncover growth opportunities so you can make informed, data-driven decisions with confidence.
Real-Time Financial Reporting Is a Business Necessity
Relying on delayed financial information can prevent businesses from responding effectively to risks and opportunities. With Finquest Business Solutions’ Financial Reporting Services and Financial Dashboard Services, organisations of every size can access accurate, enterprise-level financial insights without the expense of maintaining a large in-house finance team.
Conclusion
Your financial data provides valuable insights into the health and direction of your business. Real-time financial reporting and customised dashboards help you monitor performance as it changes, identify issues early and make confident, data-driven decisions. With clearer visibility into revenue, expenses, cash flow and profitability, your business can improve financial control and achieve sustainable growth.
Ready to gain real-time visibility into your business finances? Contact Finquest Business Solutions today to discuss a customised financial reporting and dashboard solution.
 ×
×